
Unsupervised learning is a machine learning approach that discovers patterns, relationships, groups, or unusual observations in data without requiring explicitly labeled target values.
Instead of training a model with examples such as “this transaction is fraudulent” or “this customer will churn,” you provide data and allow an algorithm to identify meaningful structure within it.
Developers use unsupervised learning for customer segmentation, anomaly detection, document clustering, dimensionality reduction, recommendation systems, exploratory data analysis, and representation learning.
Popular techniques include K-Means, DBSCAN, hierarchical clustering, Gaussian mixture models, PCA, and Isolation Forest. Modern AI applications also use vector embeddings with clustering and similarity analysis to organize large collections of text, images, and other data.
This guide explains how unsupervised learning works, the major algorithms behind it, how to evaluate results, and how to apply these techniques in real software and AI systems.
What Is Unsupervised Learning?
In supervised machine learning, a model learns from input data paired with known target labels.
For example:
Age    Income    Churn
25     45000     0
42     82000     1
31     60000     0
The model learns a relationship between the input features and the target variable.
Unsupervised learning removes that explicit target:
Age    Income
25     45000
42     82000
31     60000
The algorithm must discover useful structure from the available observations.
That structure could be:
- groups of similar records
- unusual observations
- lower-dimensional representations
- latent patterns
- probability distributions
- relationships between features
- useful numerical representations
A useful way to think about it is:
Supervised learning:
Input → Known target → Learn prediction

Unsupervised learning:
Input → Discover structure → Analyze/use structure
However, unsupervised learning does not mean the algorithm has no objective.
Every technique has its own mathematical goal.
For example, K-Means attempts to minimize the distance between observations and their assigned cluster centers, while PCA identifies directions that capture the greatest variance in the data.
How Does Unsupervised Learning Work?
A practical unsupervised learning pipeline usually looks like this:
Raw Data
   ↓
Data Cleaning
   ↓
Feature Engineering
   ↓
Scaling / Transformation
   ↓
Unsupervised Algorithm
   ↓
Discovered Structure
   ↓
Evaluation
   ↓
Domain Interpretation
   ↓
Production Use
The algorithm itself is only one part of the system.
Data preparation, feature representation, parameter selection, evaluation, and domain knowledge can significantly affect the final result.
1. Collect the Data
First, collect data relevant to the problem.
For customer segmentation, you might have:
customer_id
monthly_spend
purchase_frequency
average_order_value
days_since_last_purchase
support_tickets
For infrastructure monitoring, you might collect:
request_latency
CPU_usage
memory_usage
error_rate
request_size
token_count
For documents, raw text may eventually be converted into TF-IDF vectors or embedding vectors.
2. Clean and Transform the Data
Unsupervised algorithms can be sensitive to the way data is represented.
You may need to handle:
- missing values
- duplicate records
- outliers
- categorical variables
- skewed distributions
- irrelevant features
- inconsistent units
Feature scaling can be particularly important for distance-based algorithms.
For example, standardization transforms a feature using:
z=x−μσz = \frac{x-\mu}{\sigma}
where xx is the original value, μ\mu is the mean, and σ\sigma is the standard deviation.
3. Choose an Algorithm
The right algorithm depends on what you want to discover.
| Goal | Common Technique |
|---|---|
| Customer segmentation | K-Means |
| Density-based groups | DBSCAN |
| Hierarchical relationships | Agglomerative clustering |
| Probabilistic clusters | Gaussian Mixture Models |
| Dimensionality reduction | PCA |
| Anomaly detection | Isolation Forest |
| Nonlinear visualization | t-SNE / UMAP |
| Representation learning | Autoencoders |
There is no universally best unsupervised learning algorithm.
4. Discover Structure
The algorithm produces an output such as:
- cluster assignments
- anomaly scores
- principal components
- embeddings
- probability distributions
- similarity relationships
5. Evaluate the Results
A model can produce mathematically valid clusters that have little practical value.
Therefore, evaluation should answer two questions:
- Is the discovered structure statistically or mathematically coherent?
- Does that structure represent something useful in the real application?
What Are the Main Types of Unsupervised Learning?
Unsupervised learning includes several different families of techniques.
The most important categories are:
- Clustering
- Dimensionality reduction
- Anomaly detection
- Density estimation
- Representation learning
Let’s examine each one.
What Is Clustering in Unsupervised Learning?
Clustering groups observations according to some definition of similarity.
Imagine an e-commerce platform with millions of customers but no predefined customer segments.
A clustering algorithm might identify groups such as:
Cluster 0 → Frequent low-value buyers
Cluster 1 → Infrequent high-value buyers
Cluster 2 → Frequent high-value buyers
Cluster 3 → Recently inactive customers
The algorithm does not inherently understand these names.
The names are assigned after developers or domain experts inspect the characteristics of each cluster.
This distinction is important:
The algorithm discovers the grouping; humans often determine what the grouping means.
What Is K-Means Clustering?
K-Means is one of the most widely used clustering algorithms.
The algorithm attempts to divide observations into KK clusters.
Each cluster has a centroid representing its center.
The objective is commonly expressed as:
min∑i=1n∥xi−μci∥2\min \sum_{i=1}^{n} \|x_i-\mu_{c_i}\|^2
where:
- xix_i is an observation
- μci\mu_{c_i} is the centroid of its assigned cluster
- cic_i represents the assigned cluster
The basic process is:
- Choose KK initial centroids.
- Assign each observation to its closest centroid.
- Recalculate the centroids.
- Repeat the assignment and update process.
- Stop when the solution converges or reaches the iteration limit.
K-Means Example in Python
A simple implementation using scikit-learn looks like this:
from sklearn.cluster import KMeans
from sklearn.preprocessing import StandardScaler

X = df[
    [
        "monthly_spend",
        "purchase_frequency",
        "average_order_value"
    ]
]

scaler = StandardScaler()
X_scaled = scaler.fit_transform(X)

model = KMeans(
    n_clusters=4,
    random_state=42,
    n_init="auto"
)

df["cluster"] = model.fit_predict(X_scaled)
The important part is not simply running KMeans.
The real engineering question is whether four clusters provide a useful and stable representation of the customer population.
How Do You Choose the Number of K-Means Clusters?
The number of clusters, KK, is not automatically known.
Developers commonly consider:
- domain knowledge
- elbow analysis
- silhouette score
- cluster stability
- downstream usefulness
The silhouette coefficient evaluates how well observations fit their assigned clusters relative to neighboring clusters.
Other clustering evaluation measures include the Calinski-Harabasz and Davies-Bouldin metrics.
These metrics can help compare candidate solutions, but they should not replace domain validation.
A cluster can have a strong mathematical score and still be useless for the business.
What Is DBSCAN?
DBSCAN, or Density-Based Spatial Clustering of Applications with Noise, identifies groups based on the density of observations.
Unlike K-Means, DBSCAN does not require you to specify the number of clusters beforehand.
Two important parameters are:
eps
min_samples
eps defines the neighborhood radius, while min_samples determines how many nearby observations are needed to form a dense region.
DBSCAN is useful when:
- clusters have irregular shapes
- noise is expected
- the number of clusters is unknown
- density is meaningful
For example, consider geographic coordinates collected from delivery vehicles.
If customer locations form irregular geographic regions, DBSCAN can identify dense areas without forcing the data into spherical clusters.
A basic implementation is:
from sklearn.cluster import DBSCAN

model = DBSCAN(
    eps=0.4,
    min_samples=10
)

labels = model.fit_predict(X_scaled)
DBSCAN also has limitations.
Its results depend heavily on parameter selection, distance metrics, feature representation, and assumptions about density.
What Is Hierarchical Clustering?
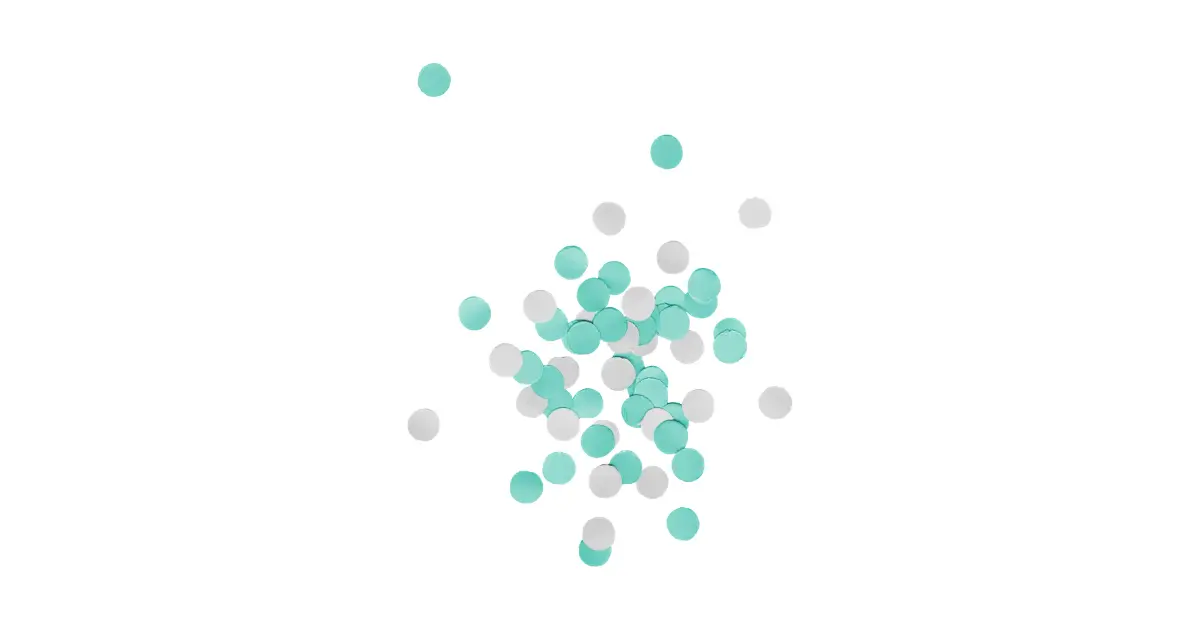
Hierarchical clustering builds a tree-like representation of relationships between observations.
Agglomerative clustering begins with every observation as its own cluster and repeatedly merges the closest groups.
Conceptually:
             ┌──────── Cluster A
       ┌─────┤
       │     └──────── Cluster B
───────┤
       │     ┌──────── Cluster C
       └─────┤
             └──────── Cluster D
The resulting hierarchy can be visualized using a dendrogram.
Different linkage strategies determine how the distance between clusters is calculated.
Common approaches include:
- Ward
- complete
- average
- single linkage
Hierarchical clustering is useful when you want to examine relationships at multiple levels rather than immediately choosing one fixed number of groups.
What Are Gaussian Mixture Models?
A Gaussian Mixture Model (GMM) represents data as a mixture of several probability distributions.
Unlike hard clustering, where an observation belongs to one cluster, GMM can provide probabilistic membership.
For example:
Customer 17

Cluster A: 72%
Cluster B: 21%
Cluster C: 7%
A simplified mixture model can be represented as:
p(x)=∑k=1KπkN(x∣μk,Σk)p(x)=\sum_{k=1}^{K}\pi_k\mathcal{N}(x|\mu_k,\Sigma_k)
where:
- KK is the number of mixture components
- πk\pi_k is the weight of component kk
- μk\mu_k is the component mean
- Σk\Sigma_k is its covariance matrix
GMMs can be useful when groups overlap rather than forming clearly separated boundaries.
What Is Dimensionality Reduction?
Modern datasets can contain hundreds, thousands, or even millions of features.
High-dimensional data can make:
- visualization difficult
- computation expensive
- distance calculations less intuitive
- redundant features more common
- downstream modeling more complicated
Dimensionality reduction transforms data into fewer dimensions while attempting to preserve useful information.
Common techniques include:
- PCA
- Truncated SVD
- t-SNE
- UMAP
- autoencoders
For example:
1,000 features
      ↓
Dimensionality Reduction
      ↓
50 features
The reduced representation can then be used for visualization, clustering, preprocessing, or downstream machine learning.
How Does PCA Work?
Principal Component Analysis (PCA) transforms correlated features into a new set of orthogonal components.
The first principal component captures the largest possible amount of variance.
The second captures the largest remaining variance while remaining orthogonal to the first.
This continues until the required number of components is produced.
For example:
from sklearn.decomposition import PCA

pca = PCA(n_components=10)

X_reduced = pca.fit_transform(X_scaled)
PCA can be particularly useful when many numerical features contain redundant information.
However, dimensionality reduction always involves tradeoffs.
Reducing 100 features to 10 components can make a dataset easier to work with, but some information may be lost.
Developers should therefore examine explained variance and validate the effect on downstream tasks.
What Is Anomaly Detection?
Anomaly detection identifies observations that differ significantly from the normal pattern.
Common applications include:
- fraud detection
- cybersecurity
- server monitoring
- manufacturing
- financial monitoring
- account security
- API abuse detection
For example:
Normal API traffic:
10–30 requests/second

Observed traffic:
4,000 requests/second
The unusual traffic could be:
- an attack
- a software bug
- a legitimate traffic spike
- a new customer
- an incorrectly configured service
Therefore, an anomaly is not automatically an error or security incident.
It is a signal that deserves additional analysis.
How Does Isolation Forest Work?
Isolation Forest is an anomaly detection algorithm based on randomly partitioning observations.
The underlying intuition is that unusual observations can often be isolated using fewer random splits than normal observations.
The algorithm creates randomized trees and examines how quickly observations become isolated.
Conceptually:
Normal observations
→ require more partitions to isolate

Unusual observations
→ require fewer partitions
A basic implementation is:
from sklearn.ensemble import IsolationForest

model = IsolationForest(
    n_estimators=200,
    contamination="auto",
    random_state=42
)

model.fit(X)

predictions = model.predict(X)
The output commonly uses:
1  → inlier
-1 → outlier
Production systems should still validate the threshold and investigate false positives before taking automated action.
How Is Unsupervised Learning Used With AI Embeddings?
Modern AI systems frequently convert text, images, and other data into numerical vectors called embeddings.
For example:
"How do I reset my password?"
can be represented as a vector:
[0.13, -0.42, 0.81, ...]
Semantically similar content can occupy nearby regions of the vector space, depending on the embedding model and similarity metric.
This creates powerful unsupervised workflows.
Example: Clustering Support Tickets
Suppose a company has 500,000 support tickets.
Instead of manually reading every ticket:
Support Tickets
      ↓
Embedding Model
      ↓
Vector Representations
      ↓
Clustering
      ↓
Topic Discovery
      ↓
Human Validation
The system might reveal clusters around:
Password problems
Billing issues
Account verification
API errors
Subscription cancellation
The algorithm discovers the groups.
A human reviews representative examples and assigns meaningful labels.
This is an important pattern in modern AI engineering:
Machine learning can discover structure, while humans validate and interpret that structure.
What Is the Difference Between Supervised and Unsupervised Learning?
The primary difference is the training signal.
| Feature | Supervised Learning | Unsupervised Learning |
|---|---|---|
| Target labels | Required | Not explicitly required |
| Primary goal | Predict known targets | Discover structure |
| Common tasks | Classification, regression | Clustering, anomaly detection |
| Example | Predict customer churn | Discover customer segments |
| Evaluation | Often uses labeled test data | Internal metrics + domain validation |
| Typical output | Predicted target | Groups, scores, representations |
There are also related approaches.
Semi-supervised learning combines labeled and unlabeled data.
Self-supervised learning creates training targets from the data itself.
These concepts are related but should not be treated as identical to traditional unsupervised learning.
What Is the Difference Between Unsupervised and Self-Supervised Learning?
This distinction is increasingly important in modern AI.
Traditional unsupervised learning generally focuses on discovering structure without explicit human-provided labels.
Self-supervised learning creates a training objective from the input data.
For example:
Input:
"The capital of France is ___"

Generated training target:
"Paris"
The training signal comes from the data rather than from manually created labels for every example.
Large language models use self-supervised objectives extensively during pretraining.
Therefore:
Unsupervised learning
→ discover structure

Self-supervised learning
→ generate a learning signal from the data
They overlap conceptually but describe different learning setups.
What Are Real-World Applications of Unsupervised Learning?

Unsupervised learning appears in many production and research workflows.
Customer Segmentation
Companies can group customers based on behavior such as:
- purchase frequency
- average order value
- recency
- session duration
- discount usage
The resulting groups can support analytics and personalization.
Fraud Detection
Anomaly detection can highlight transactions that differ from normal behavioral patterns.
The result can then be combined with rules, supervised models, and human review.
Log Analysis
Engineering teams can cluster similar logs to identify recurring operational problems.
For example:
Database timeout
Database timeout
Cache miss
Authentication failure
Database timeout
Clustering can help organize large quantities of operational data.
Recommendation Systems
Unsupervised representations can identify similar users, products, documents, or other objects.
These representations can then become inputs to recommendation or ranking systems.
Search and Information Retrieval
Embeddings allow systems to compare semantic similarity between queries and documents.
Clustering can also help organize large document collections into topics.
Manufacturing
Sensor data such as:
temperature
vibration
pressure
motor current
rotation speed
can be analyzed to identify unusual operating conditions.
How Do You Evaluate Unsupervised Learning?
Evaluation becomes more complicated when ground-truth labels are unavailable.
A strong evaluation strategy usually combines several methods.
Internal Evaluation
Internal clustering metrics evaluate the mathematical structure of the resulting clusters.
Examples include:
- Silhouette score
- Calinski-Harabasz score
- Davies-Bouldin score
These can help compare different clustering configurations.
They do not prove that a cluster has real-world meaning.
External Evaluation
If reliable labels become available, discovered clusters can be compared against those labels.
Metrics such as adjusted Rand index and mutual information-based measures can be useful in appropriate scenarios.
Human Evaluation
For text clustering, domain experts can inspect representative documents.
For example:
Cluster 7

Top examples:
- Password reset request
- Cannot reset login
- Forgot account password
A reviewer can determine whether the cluster represents a meaningful topic.
Downstream Evaluation
Another option is to evaluate whether the learned representation improves a later task.
For example:
Raw Features
      ↓
PCA
      ↓
Classifier
      ↓
Evaluate Accuracy
If the reduced representation improves efficiency while maintaining acceptable performance, PCA may provide practical value.
Why Does Feature Scaling Matter in Unsupervised Learning?
Many unsupervised algorithms rely on distance calculations.
Consider:
Age:             18–80
Annual income:   $20,000–$500,000
Without appropriate scaling, income can dominate the distance calculation.
A standardization step can help:
from sklearn.preprocessing import StandardScaler

scaler = StandardScaler()

X_scaled = scaler.fit_transform(X)
However, scaling should not be treated as a universal rule.
The correct preprocessing strategy depends on:
- algorithm
- feature distributions
- data types
- distance metric
- downstream objective
For heavily skewed data, other transformations may be more appropriate.
What Are the Limitations of Unsupervised Learning?
Unsupervised learning has several important limitations.
The Algorithm Can Find Meaningless Patterns
A dataset can contain statistical patterns that have no useful business or scientific interpretation.
Results Depend on Feature Representation
Changing the features can completely change the resulting clusters.
Parameter Selection Matters
Different parameter values can produce very different results.
High-Dimensional Data Is Difficult
As dimensionality increases, distance-based relationships can become less intuitive.
Evaluation Can Be Ambiguous
Without ground-truth labels, determining whether a discovered pattern is correct can be difficult.
Anomalies Are Not Automatically Errors
An unusual observation may be legitimate.
This is especially important when anomaly detection is used in security or financial systems.
How Should Developers Choose an Unsupervised Learning Algorithm?
Start with the problem rather than the algorithm.
Choose K-Means when:
- the number of clusters can be estimated
- clusters are relatively compact
- distance-based grouping makes sense
- you need a fast baseline
Consider DBSCAN when:
- clusters may have irregular shapes
- noise is expected
- the number of clusters is unknown
- density is meaningful
Consider hierarchical clustering when:
- you need multiple levels of grouping
- relationships between groups are important
- a dendrogram is useful
Consider Gaussian Mixture Models when:
- cluster membership can overlap
- probabilistic assignments are useful
- a mixture-distribution assumption makes sense
Consider PCA when:
- you need dimensionality reduction
- features are correlated
- visualization or preprocessing is required
Consider Isolation Forest when:
- anomaly detection is the primary goal
- you need to identify unusual observations
- tree-based random partitioning fits the problem
The best choice depends on the data and the actual engineering objective.
What Does Unsupervised Learning Look Like in a Production AI System?
Consider a company with five million historical customer-support tickets.
The engineering team wants to discover recurring support topics.
A practical architecture could look like this:
Support Tickets
       ↓
Text Cleaning
       ↓
Embedding Model
       ↓
Vector Storage
       ↓
Sampling / Dimensionality Reduction
       ↓
Clustering
       ↓
Cluster Analysis
       ↓
Human Validation
       ↓
Topic Labels
       ↓
Dashboard / Routing / Automation
Notice that there is no single “unsupervised learning model” responsible for everything.
The system combines:
- data processing
- embedding generation
- vector storage
- clustering
- evaluation
- human review
- application logic
This is how unsupervised learning often appears in real AI engineering: as one component inside a larger pipeline.
How Can Developers Make Unsupervised Learning More Reliable?
Use Representative Data
The training dataset should represent the population where the system will operate.
Version the Pipeline
Track:
Dataset version
Feature definitions
Preprocessing
Algorithm
Hyperparameters
Model version
Evaluation results
This makes experiments reproducible.
Test Cluster Stability
Run the algorithm with different random seeds, samples, or time periods.
If tiny changes completely alter the resulting groups, the structure may not be stable enough for production.
Inspect Feature Distributions
A cluster may exist simply because one feature dominates the distance calculation.
Always investigate why the algorithm created the grouping.
Combine Metrics With Human Review
Quantitative metrics and domain expertise answer different questions.
Use both where appropriate.
Monitor Data Drift
Production data changes over time.
Customer behavior, application traffic, products, and infrastructure can all change.
A model trained months ago may therefore no longer represent the current population.
What Are Common Unsupervised Learning Mistakes?
1. Treating Clusters as Facts
A cluster is an algorithmic grouping, not automatically a real-world category.
2. Ignoring Feature Engineering
Poor features can create misleading patterns.
3. Using an Inappropriate Distance Metric
Euclidean distance is not suitable for every type of data.
4. Choosing K Arbitrarily
Do not choose the number of clusters simply because the visualization looks attractive.
5. Relying on One Evaluation Metric
A single score rarely establishes that a clustering solution is useful.
6. Ignoring Data Leakage
Preprocessing should be designed carefully so information from future or held-out data does not influence the analysis improperly.
7. Assuming Everything Can Be Automated
Human interpretation is often necessary, particularly when the output affects business decisions or customer-facing systems.
Frequently Asked Questions About Unsupervised Learning
What is unsupervised learning in simple terms?
Unsupervised learning allows an algorithm to analyze unlabeled data and discover patterns, groups, relationships, or unusual observations within it.
What is an example of unsupervised learning?
Customer segmentation is a common example. A company can provide customer behavior data to a clustering algorithm and discover groups of customers with similar purchasing patterns.
Is K-Means supervised or unsupervised?
K-Means is an unsupervised learning algorithm because it groups observations without requiring predefined class labels.
Is PCA an unsupervised learning technique?
Yes. PCA is commonly used as an unsupervised dimensionality-reduction technique because it identifies directions of variance without requiring target labels.
Can unsupervised learning detect anomalies?
Yes. Algorithms such as Isolation Forest can identify observations that differ from the majority of the dataset.
What is the difference between K-Means and DBSCAN?
K-Means requires a predefined number of clusters and generally works best when clusters are relatively compact. DBSCAN groups observations based on density and can identify noise without requiring the number of clusters beforehand.
Is unsupervised learning used in generative AI?
Yes, but modern generative AI training often relies heavily on self-supervised learning rather than classical unsupervised algorithms such as K-Means or DBSCAN.
What should I learn before unsupervised learning?
A basic understanding of Python, statistics, vectors, matrices, probability, feature engineering, and machine learning fundamentals will make unsupervised learning easier to understand and implement.
Key Takeaways
Unsupervised learning helps machine learning systems discover structure in data without relying on explicitly provided target labels.
The most important concepts to remember are:
- Clustering groups similar observations.
- K-Means provides a strong baseline for certain compact clustering problems.
- DBSCAN discovers density-based groups and can identify noise.
- Hierarchical clustering reveals relationships between groups.
- Gaussian Mixture Models provide probabilistic cluster membership.
- PCA reduces the dimensionality of numerical data.
- Anomaly detection identifies observations that differ from learned patterns.
- Embeddings make unsupervised analysis useful for modern text and multimodal AI systems.
- Evaluation requires more than a single metric.
- Human validation is often necessary.
- Production systems require reproducibility, monitoring, and drift detection.
The central idea is simple:
Unsupervised learning discovers structure, but discovering structure is not the same as discovering truth.
The quality of the data, feature representation, preprocessing, algorithm, evaluation strategy, and domain interpretation determines whether that discovered structure becomes useful.
For developers, the most effective approach is therefore to treat unsupervised learning as an engineering workflow rather than simply calling a clustering function and accepting its output.

AiVoogle – AI Tutorials & AI Tools
AiVoogle is an AI-focused platform sharing practical AI tutorials, AI tools, guides, reviews, and the latest trends in artificial intelligence. Our goal is to make AI simple, useful, and accessible for everyone—from beginners and creators to marketers, developers, and businesses.
The AiVoogle team researches and covers the latest AI tools and technologies to help readers discover the right tools and learn how to use AI effectively.
Focus: AI Tutorials | AI Tools | AI Guides | AI News | AI Reviews